

Located in London, I measured the RTT or round trip time to 574,691 random webservers and plotted the times on the globe.
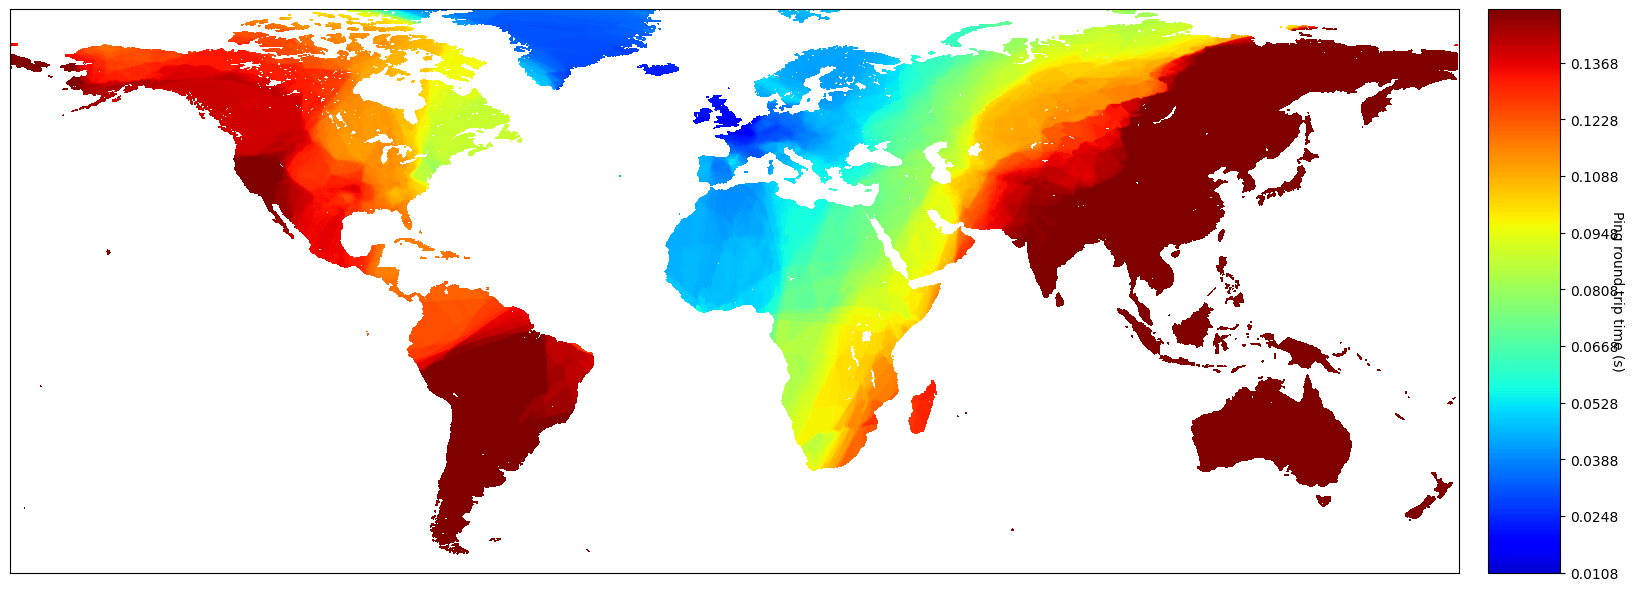
Discovery was done with masscan, measurements using hping and plotting with an old Python script I’ve revived and enhanced.
This is part of the next writeup on my blog, with which I will be posting any of the code I’ve used.
Cool visualisation!
Thanks! The coolest part IMO is when you overlay it with the subnautical fiber optic network. The north of spain, the US east coast, South-Africa, Brazil, etc all show almost exactly where these cables connect the continents.
Could you calculate shortest distance to each point (using for example haversine formula) and then divide each time you got by 2*distance/c to get some sort of normalized score for connectivity? Anything closely approaching 1 would be the optimal connectivity to that destination.
Edit: c would be speed of light
Great idea! I’ll be writing some code later to calculate distances first.
Cool I’m super interested in the result. I’m marking the post!
Edit: I also love the visualizations, didn’t make that clear in first reply 🫣
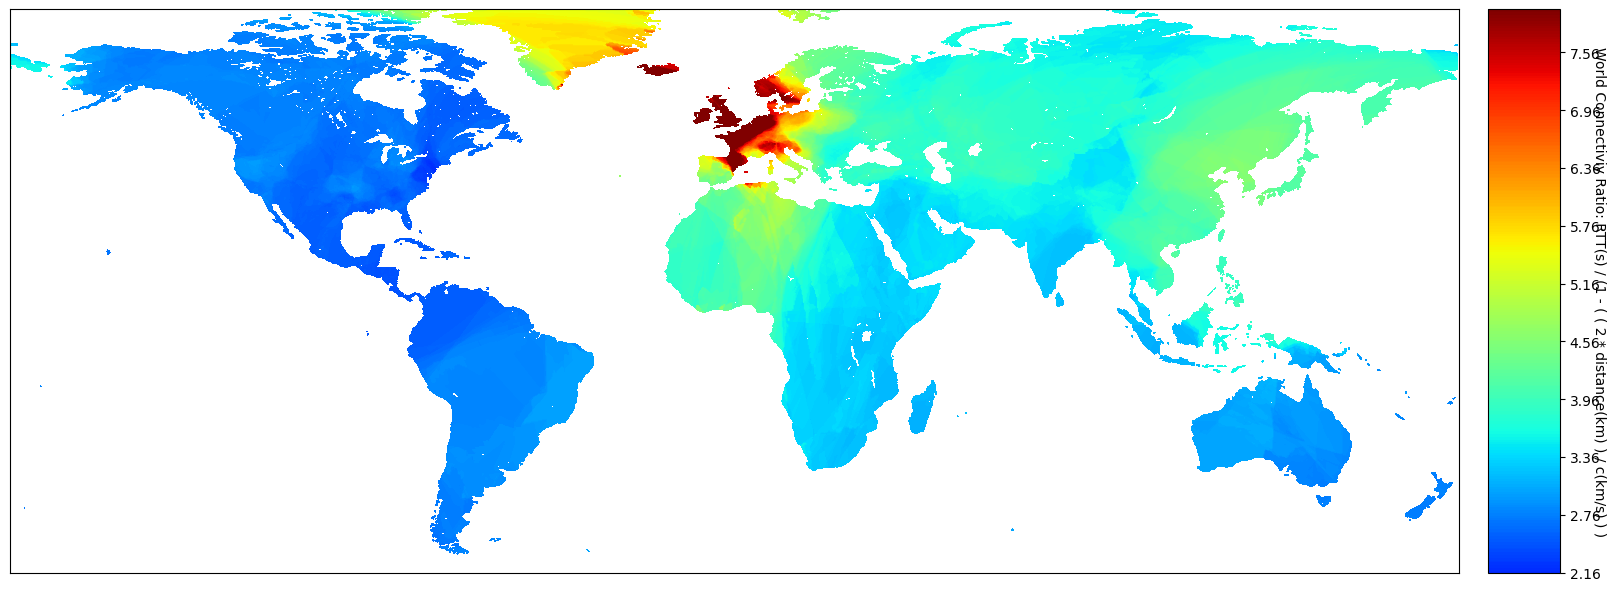
Hard to get the scaling right but I messed around a bit, here’s RTT / (2 * Distance / c )
Scaling on Europe is fun too
Super cool plot! Few questions, I was trying to read the scale bar. It says RTT/(1-(2*distance/c)). I guess that’s a typo? otherwise I’m not sure what it would mean.
Then the scaling goes up to 10, did you multiply by 10 or did you inverse the values? (Inverting would mean higher values = lower connectivity? which I guess is possible in Europe if we have to consider the routing ?).
Also it’s very interesting how uniform the whole American continent is.Ah yeah ofcourse I was experimenting with comparing it with the lightspeed itself, then inverting it with -1 so its coloured correctly. My mistake not changing the label enough.
Then the scaling goes up to 10
That is actually the real scale, in Europe we get theoretical speeds of 2-3ms according to the speed of light. Real RTT’s in Amsterdam for example are around 20ms, so you get values >10. The further you go from the EU, the closer to ideal times.
It’s interesting to see the places where connectivity is much better or worse than the surrounding areas.
Alright thanks! so it means you’re showing RTT theoretical/RTT actual? That makes sense!
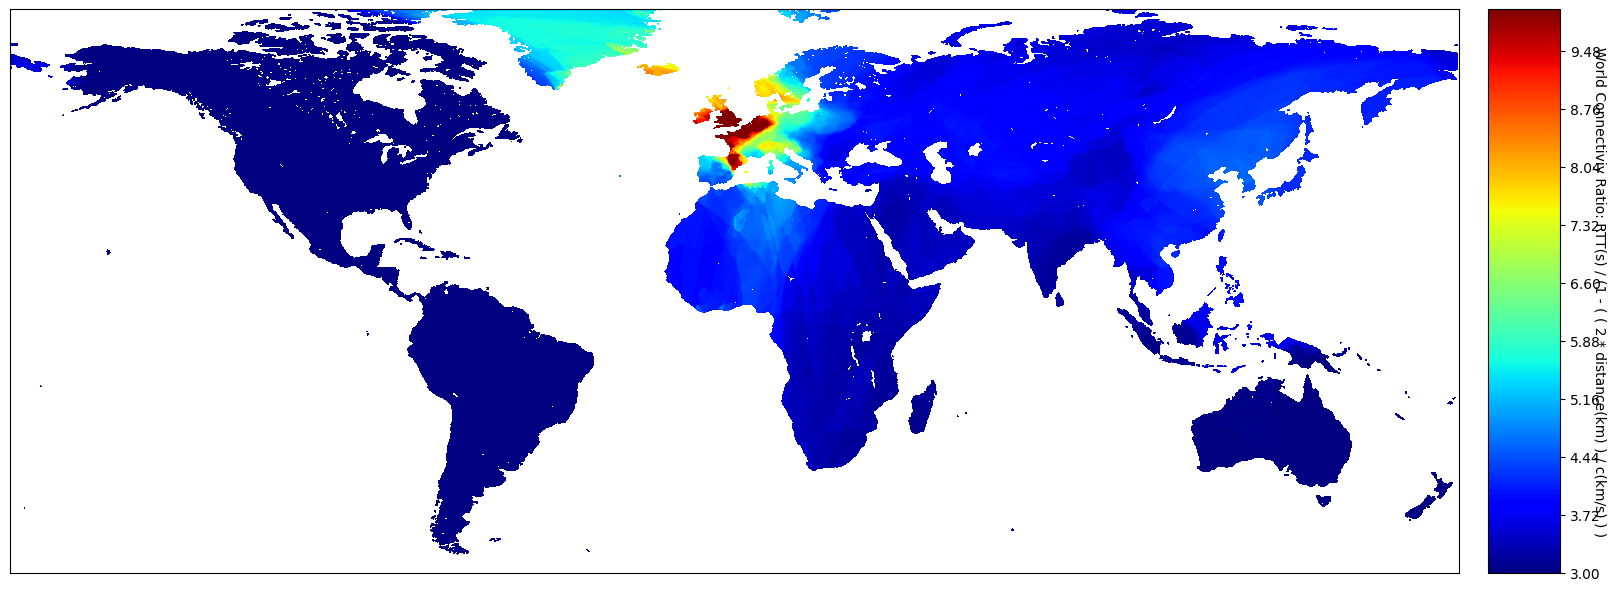
That was experimenting, the actual graph shown is the other way around, so it shows the real differences, not just compared to lightspeed (ie I forgot to remove the ‘1 -’ from the label)
So this looks like the closer the server, the less efficient (more convoluted) the path to it is. Very cool.
I’m thinking its harder to get sub 15ms consistently maybe? Brussels, Amsterdam, Paris, expected lightspeed times of 1-2ms, in reality you’ll get 10-20ms.
Global internet is optimized for global connectivity, I’m imagining resources are better spent optimizing the 50-200ms range than the 1-10ms.
In normal fiber optic cables the signal only travels at ~60% of speed of light. I dont think hollow core fibers are widely adopted yet for undersea cables, so the results should reflect that. Ofcourse you also have delays due to the relay stations in between, but those are probably quite small.
Is there an ELI5 for fiber optic questions? Am interested in how they’re made, properties of different types, and how signals are sent/repeated etc.
Im too dumb to do real ELI5, but basically fibers are never perfect and light will never travel perfectly straight through it and instead bounce around unpredictably inside the material. So the the actual distance that the light has to travel to get to the target is much larger than the length of the fiber.
To get the latency down you want to the light to travel uninhibited. To achieve this people have come up with “hollow core” fibers which are basically just very long, very thin, very precise tubes with a vacuum inside that light travels through. The following pic shows what these look like.

Light will still not travel perfectly straight in these but it will only be able to bounce off the walls and not off any imperfections in the fiber material (because there is none). Here the travel time is decided by how straight you can inject your light beam into the hole. The last pic with the glass pane shows what would happens if its not very straight…

Makes sense. It’s actually quite cool. Our internet signals. Encoded in (I’m guessing) light waves instead of radio waves, with similar multiplexing/ways of maximising signal bandwidth?
I’m staggered by how small these are and how flexible they are.
Thank you very much for that in-depth explanation!
If you have any more of that, I’d be very interested :-)This is just what i picked up from my colleagues at work while i was helping them with electronics trouble in their lab. They are doing research using attosecond length laser pulses, which is why they needed to use hollow core stuff to keep the signal fast and clean. If you dont remember what atto means those pulses are 0.000000000000000001 seconds long (well in that range not actually 1 attosec more like tens to hundreds of attosecs). But yeah thats all i know ^^
For more technical details from Wikipedia:
Optical fiber > Refractive index
The refractive index is a way of measuring the speed of light in a material. Light travels fastest in a vacuum, such as in outer space. The speed of light in vacuum is about 300,000 kilometers (186,000 miles) per second. The refractive index of a medium is calculated by dividing the speed of light in vacuum by the speed of light in that medium. The refractive index of vacuum is therefore 1, by definition. A typical single-mode fiber used for telecommunications has a cladding made of pure silica, with an index of 1.444 at 1500 nm, and a core of doped silica with an index around 1.4475.[65] The larger the index of refraction, the slower light travels in that medium. From this information, a simple rule of thumb is that a signal using optical fiber for communication will travel at around 200,000 kilometers per second. Thus a phone call carried by fiber between Sydney and New York, a 16,000-kilometer distance, means that there is a minimum delay of 80 milliseconds (about 1/12 of a second) between when one caller speaks and the other hears.[c]
deleted by creator
LEO satellite comms coming online to route some of this traffic should be closer to c since will relay satellite to satellite to the last mile ground station to then reach the destination.
It is faster per distance covered, but the distance that needs to be covered is significantly larger so it cancels out i think.
I haven’t digested this whole paper, but it seems like it would be faster than fiber all the way. https://people.eecs.berkeley.edu/~sylvia/cs268-2019/papers/starlink.pdf
Thanks for the source :)
Starlink’s LEO satellites will be in 1,110 to 1,325 km orbits. Although much lower than GEO, this is still too high to pro- vide lower latency than fiber over shorter distances. However, over longer distances the extra latency getting between Earth and the nearest satellite may be more than offset by routing around the world between the satellites at c.
So yeah makes sense. The inital distance to space completely tanks the short distance latency, but eventually gets compensated by the higher transmissions speed when trying to cover longer distances. I havent found it yet, but what i really wanna know is the distance value at which sat overtakes fiber. I dont think this paper covers that sadly.
Whats annoying is the US gave incentives to deploy fiber but it did not really happen the way it was supposed to. I believe canada had similar. east coast should be blasting down fiber to the west coast and they should be more orange in both cases.
Huh. So the world is a circle.
Can you show different projections? Like one that keeps distances from you the same (countries will look very stretched at the far end but radial distances from you are preserved). It looks like the latency doesn’t quite follow physical distance from you, but it’s hard to tell because of the projection.
(Interesting map though, thank you!)
Azimuthal Equidistant Projection shows the equal distances, probably my favorite

Mercator Projection is good too

Thanks!
Is that Azimuthal projection centred on London though? It looks like it’s centred in Africa but maybe that’s just because the top-left is cropped off because it’s all ocean?
Nice catch! I centered there to fit the entire world on the map. Here’s centered on London:
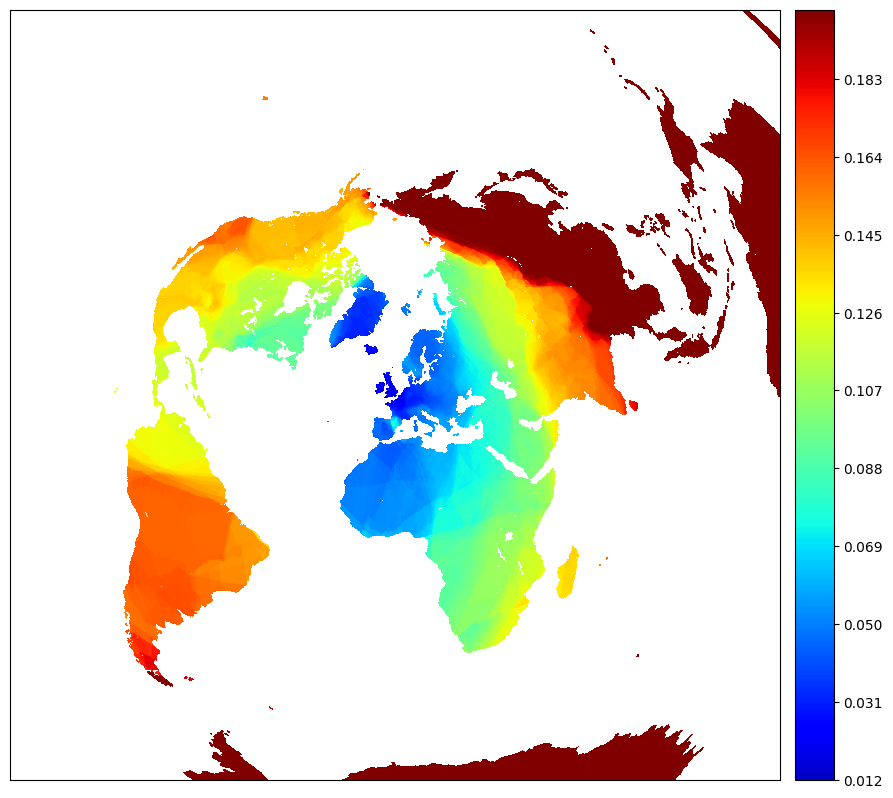
Nice. That shows a bit clearer how geography, not just distance, affects latency.
Just a little nitpick: could I persuade you to consider a color scale that goes from light to dark luminance like viridis? https://cran.r-project.org/web/packages/viridis/vignettes/intro-to-viridis.html
This is an Azimuthal projection with viridis, tried a few but liked this one the best!
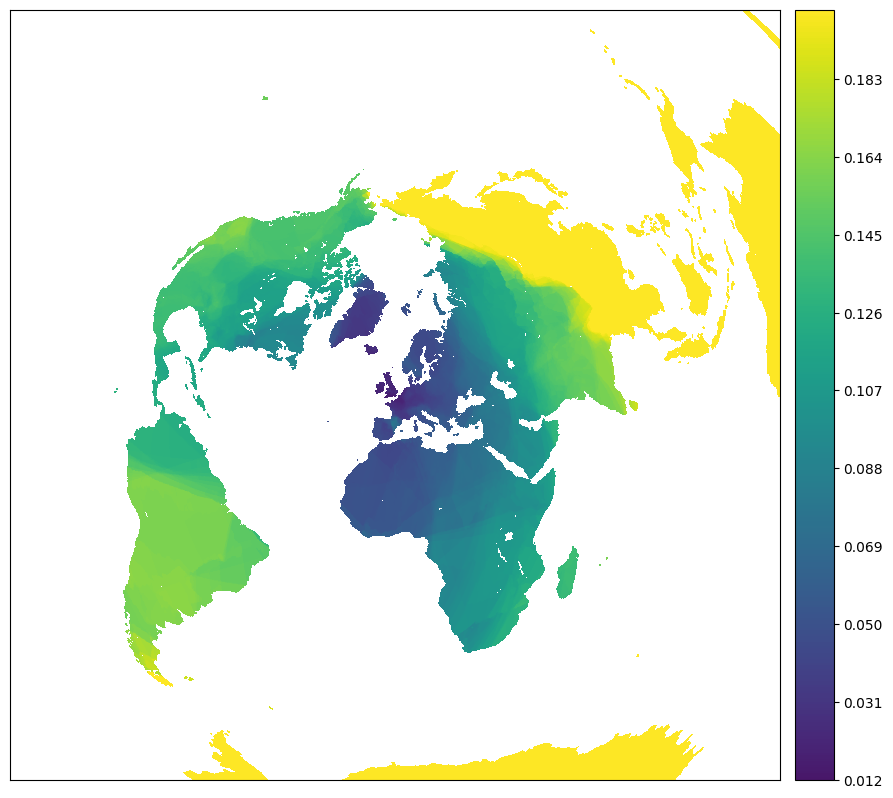
Looks great I’ll be checking different color scales, I’m still figuring out the plotting library though.